Our Work
Let our combination of Power BI and Construction expertise help bring clarity to your data. Find some examples of our data analytic and visualization capabilities below.
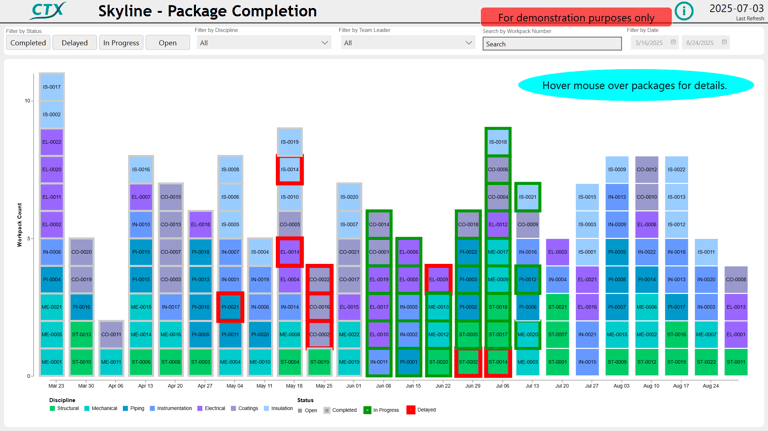
Completions Skyline
Get frequent updates on your completion packages without the labor-intensive task of manual updates to this popular chart.
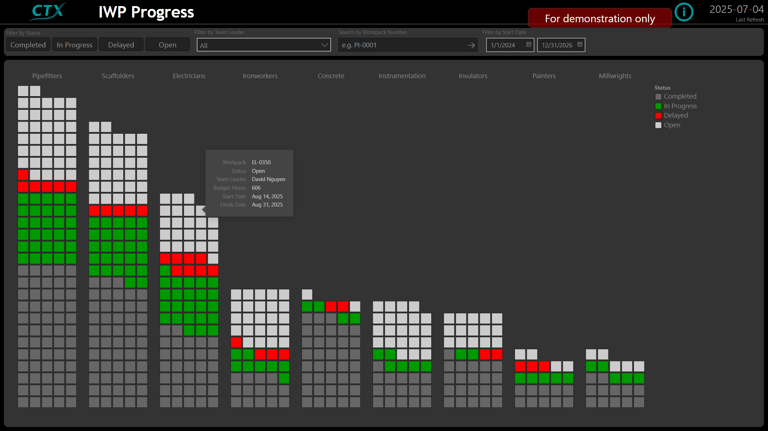
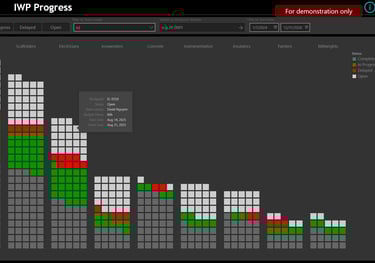
IWP Progress
The whole is greater than the sum of its parts. Help each team member see the whole and the parts together, and how their piece fits into the bigger picture.
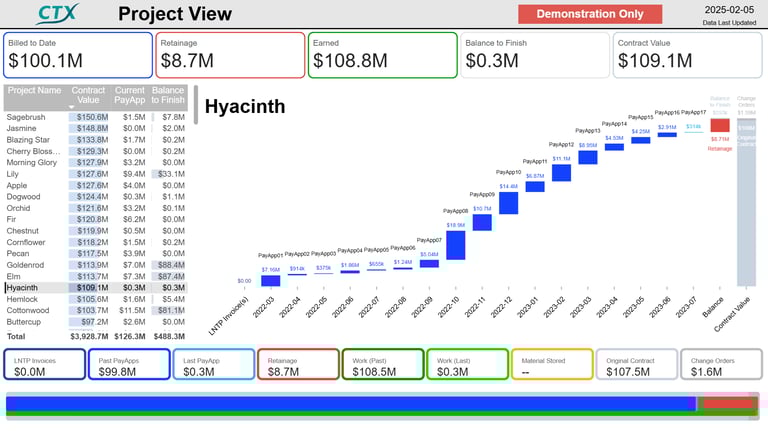
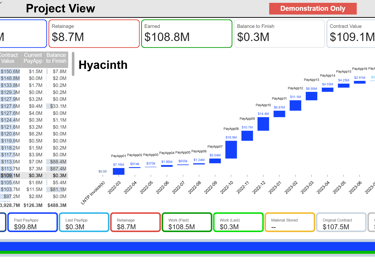
Invoices / Payapps Status
See your invoices at the portfolio level, by project, or invoice line items. Know how much has been earned, billed, paid, held back, and remain to go at a glance.
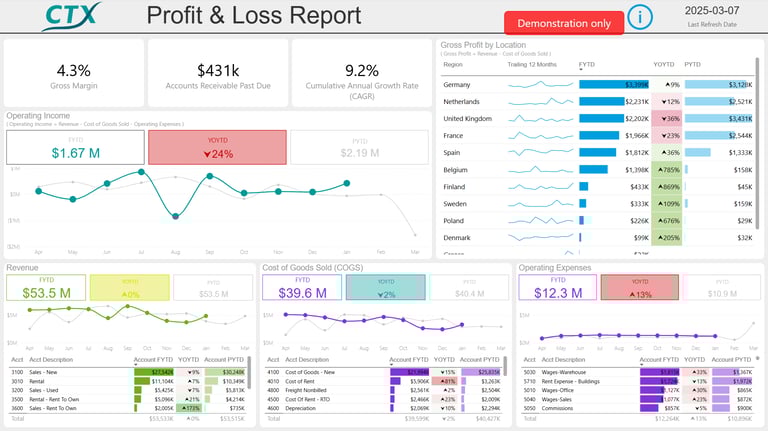
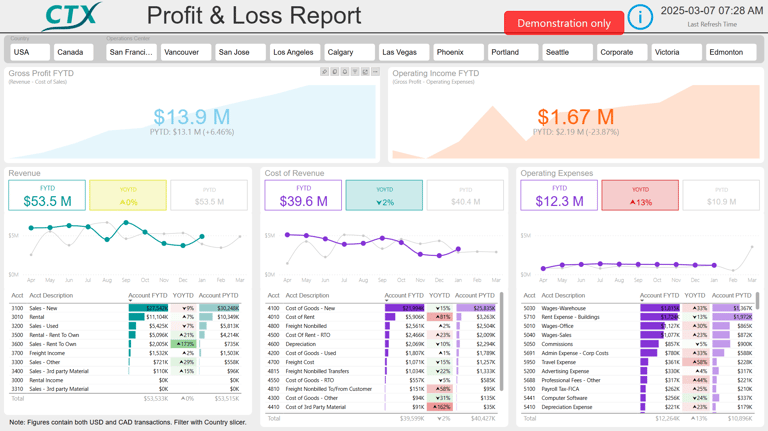
Profit and Loss Summary
See your profit and loss numbers daily - overall, by channel, by department, by country, by location, etc., all without taxing your finance and accounting team.
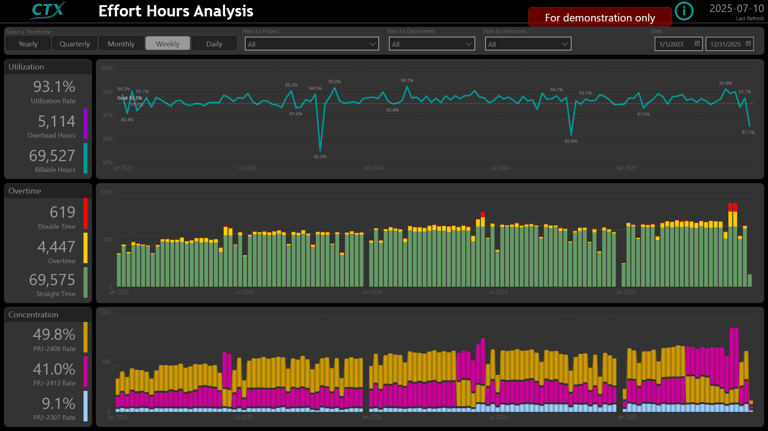
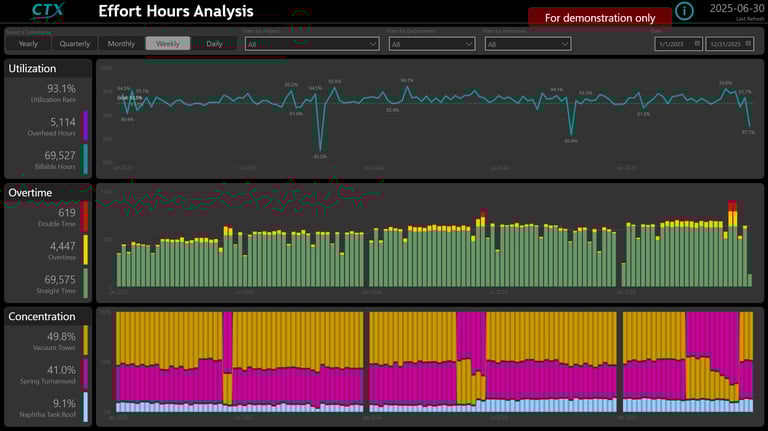
Effort Hour Analysis
Quickly see where your team members are spending their time, including utilization, overtime, concentration, or other relevant measures.
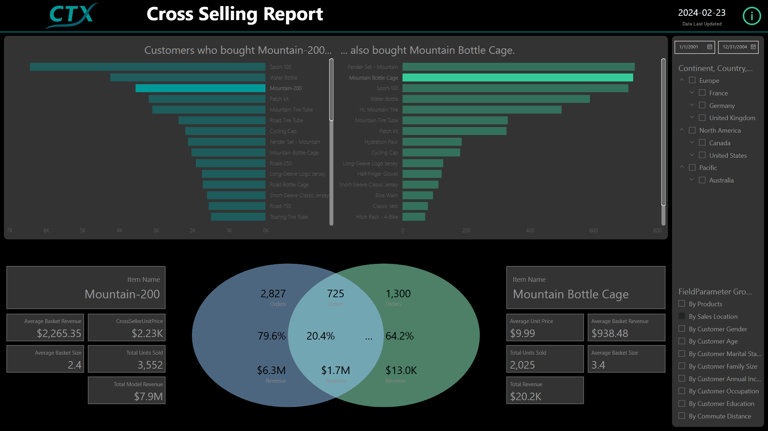
Cross Selling Explorer
Customers who bought X also bought Y. This interactive data mining technique identifies up-sell and cross-sell opportunities by revealing customer behavior patterns.
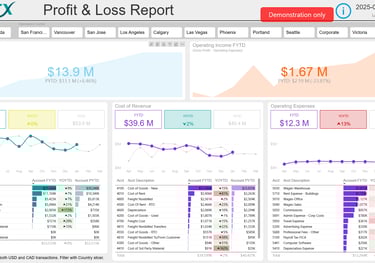
Profit and Loss Summary
See your profit and loss numbers daily - overall, by channel, by department, by country, by location, etc., all without taxing your finance and accounting team.
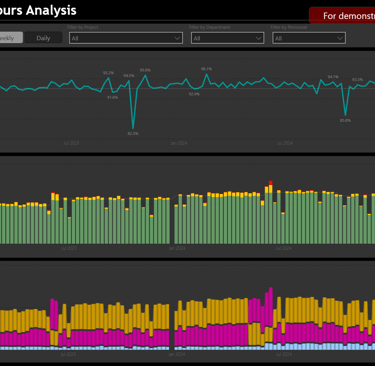
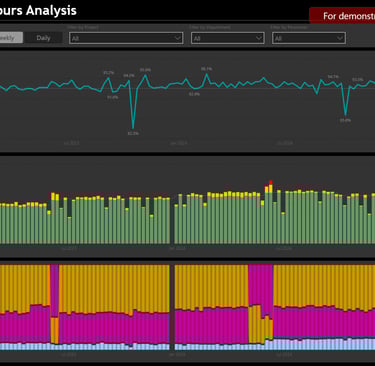
Effort Hour Analysis
Quickly see where your team members are spending their time, including utilization, overtime, concentration, or other relevant measures.
Cross Selling Discovery
Customers who bought X also bought Y. This data mining technique identifies up-sell and cross-sell opportunities by revealing customer behavior patterns.